
You mapped, analyzed, redesigned and measured your process. What is left is the part that turns work into a proven result: the final delivery. It is not an exam — it is consolidating what you did and reflecting on what you learned. In this guide you will see how to close a process improvement cycle: check your progress, measure with indicators, assemble the presentation and record the lessons learned.
1. The final delivery in one sentence
The delivery of a BPM cycle is one document with two parts: what you did (the real process data — activities, opportunities, indicators) and what you learned (the lessons learned that you write). In BPM Together, that document is the file apresentacao_dados.txt — and you do not write it from scratch: the F key generates the skeleton from your board (the walkthrough is in section 4) and you fill in the reflection. Plus the link to your board. One file, two parts.
2. Checking your progress (the process “check-in”)
Before delivering, do a check-in: is your cycle complete? In the course, the answer comes from the P key — Check your progress (documented as card 07 in the Reference list on your board). It runs verificar_processo.py, which reads the board and shows, without you typing anything:
- The path through the 5 phases of the BPM cycle — what is done and what is missing, with the concrete next step.
- The 4 measures of the process (M1–M4) with a traffic light.
- Prioritized recommendations for moving forward.
The track does not lie: the measures come from the real artifacts on the board (activities, opportunities, indicators), not from what you declare you have done.
How to run it: double-click Iniciar.bat (on a Mac, Iniciar.command) and press P — or, in the terminal, python verificar_processo.py in the course folder. Run it as often as you like — preferably every week, as a check-in. When all the core steps are [OK], you are ready for the final presentation.
3. The four measures of your process (M1–M4)
A well-run cycle is not about “who made the most boxes” — it is about running the whole cycle with depth:
- M1 — Cycle coverage: % of core steps completed (board → AS-IS → analysis → TO-BE → indicators).
- M2 — Modeling depth: the number of activities in the AS-IS + TO-BE.
- M3 — Analysis richness: how many improvement opportunities you found.
- M4 — Measurement maturity: how many indicators, balancing efficiency and effectiveness.
4. The final presentation: preparing apresentacao_dados.txt
With the cycle complete, you consolidate everything. In the course, that is the F key — Final presentation (documented as card 08), which runs apresentacao_final.py. The delivery, step by step:
- Press
Pand resolve whatever is missing, until every core step is [OK]. - Press
F— or runpython apresentacao_final.pyin the terminal. In one pass, without you typing anything, it generatesapresentacao_dados.txtin the course folder, next to the scripts — with the process summary, the 4 measures, the AS-IS, the opportunities, the TO-BE and the indicators — and creates the “PROCESS SUMMARY” card on the board. - Open
apresentacao_dados.txtand check the automatically generated part: it is the photograph of what you did. - Fill in the Lessons Learned: at the end of the file there is a template with nine sections (detailed in section 5 below) — write your answers and delete the instructions in parentheses.
- Submit: the completed
apresentacao_dados.txt+ the link to your board. No.zipand no screenshots: one file, with everything inside.
That file is Part 1 of the delivery (what you did, read automatically from the board). Part 2 is still missing: your reflection.
5. The Lessons Learned (the part that counts most)
Reflection closes the cycle — and it is what turns experience into learning. The template included at the end of apresentacao_dados.txt has nine sections; fill in all of them:
- The main question — what did you REALLY change in your process? For each change, mark its status: [IN PRACTICE] (already really running), [DECIDED] (scheduled, but not running yet) or [ON PAPER ONLY] (and what is missing to get it off paper). A prettier process on the diagram is worth nothing if nothing changed in real life — be honest.
- The top 5 (re)design decisions that worked best — and why.
- The top 3 things that did not work (or that you would redo).
- Recommendations for someone managing a process for the first time.
- What came from the method (scripts, AI) and what came from your own effort.
- Your BPM maturity today and your deliberate next step.
- Improvements for your next process.
- How much closer the process is to the expected value (use the indicators — be honest).
- Course feedback (optional): what to improve in the method itself — the method applied to itself.
6. How the assignment is assessed
The assessment has two independent parts — you can ace one and score zero on the other:
- Part 1 — Execution: the real work on the board (the 4 measures + the complete cycle), read objectively.
- Part 2 — Reflection: the lessons learned, assessed on depth and honesty.
An impeccable board and a blank reflection = half the grade. A deep reflection and an empty board = the other half. Both count. In BPM Together, completing the quizzes for each lesson + submitting the final assignment earns the BPM Together Certificate.
7. Frequently asked questions
Do I need a slide deck?
No. The delivery is a document (process data + lessons learned) and the board link. If you are presenting to a manager, the same data becomes the “before and after” scoreboard.
Where do I find cards 07 and 08?
In the Reference list on your board in ProjectAdm (card 01 creates that list at the start of the course). Each card says what it does, how to run it and what comes next. The keys P and F in the Iniciar.bat menu are how you actually run them.
What if one of the measures comes out low?
Go back to the matching phase: a thin analysis (M3) → find more opportunities; no indicators (M4) → define how to measure. The measures point to where the cycle stayed shallow.
Why record lessons learned?
Because the board proves what you did, but only the reflection proves what you understood — and it feeds the next process (and the method itself).
What are AS-IS and TO-BE again?
AS-IS is the process as it is today; TO-BE is how it should be after the redesign. The final delivery consolidates both and measures the difference.
Conclusion and next steps
Closing a process cycle is consolidating (what you did, with a number) and reflecting (what you learned). Once that is done, you do not finish — you start again: take the method to more processes in your value chain. BPM is a journey, not a destination. Answer the quiz below to consolidate; it counts towards your BPM Together Certificate.
References
ABPMP. BPM CBOK — Guide to the Business Process Management Common Body of Knowledge, version 4.0. · Escritório de Projetos. BPM Together — Final Assignment and Assessment.
Content based on the BPM CBOK 4.0 (ABPMP) and on the practical experience of Escritório de Projetos. This is an independent practitioner’s guide: it is not an official ABPMP publication and has not been endorsed by the association.
Project Together
Track your progress through PMBOK 8
Create your free account to save your reading progress, earn points on every quiz, and unlock certificates as you master each domain.
Create Free Account →Free forever • No credit card required
QUIZ
Want to test what you learned from this article?
One multiple-choice question + one practical reflection. Earn Project Together points!
Go deeper in the book
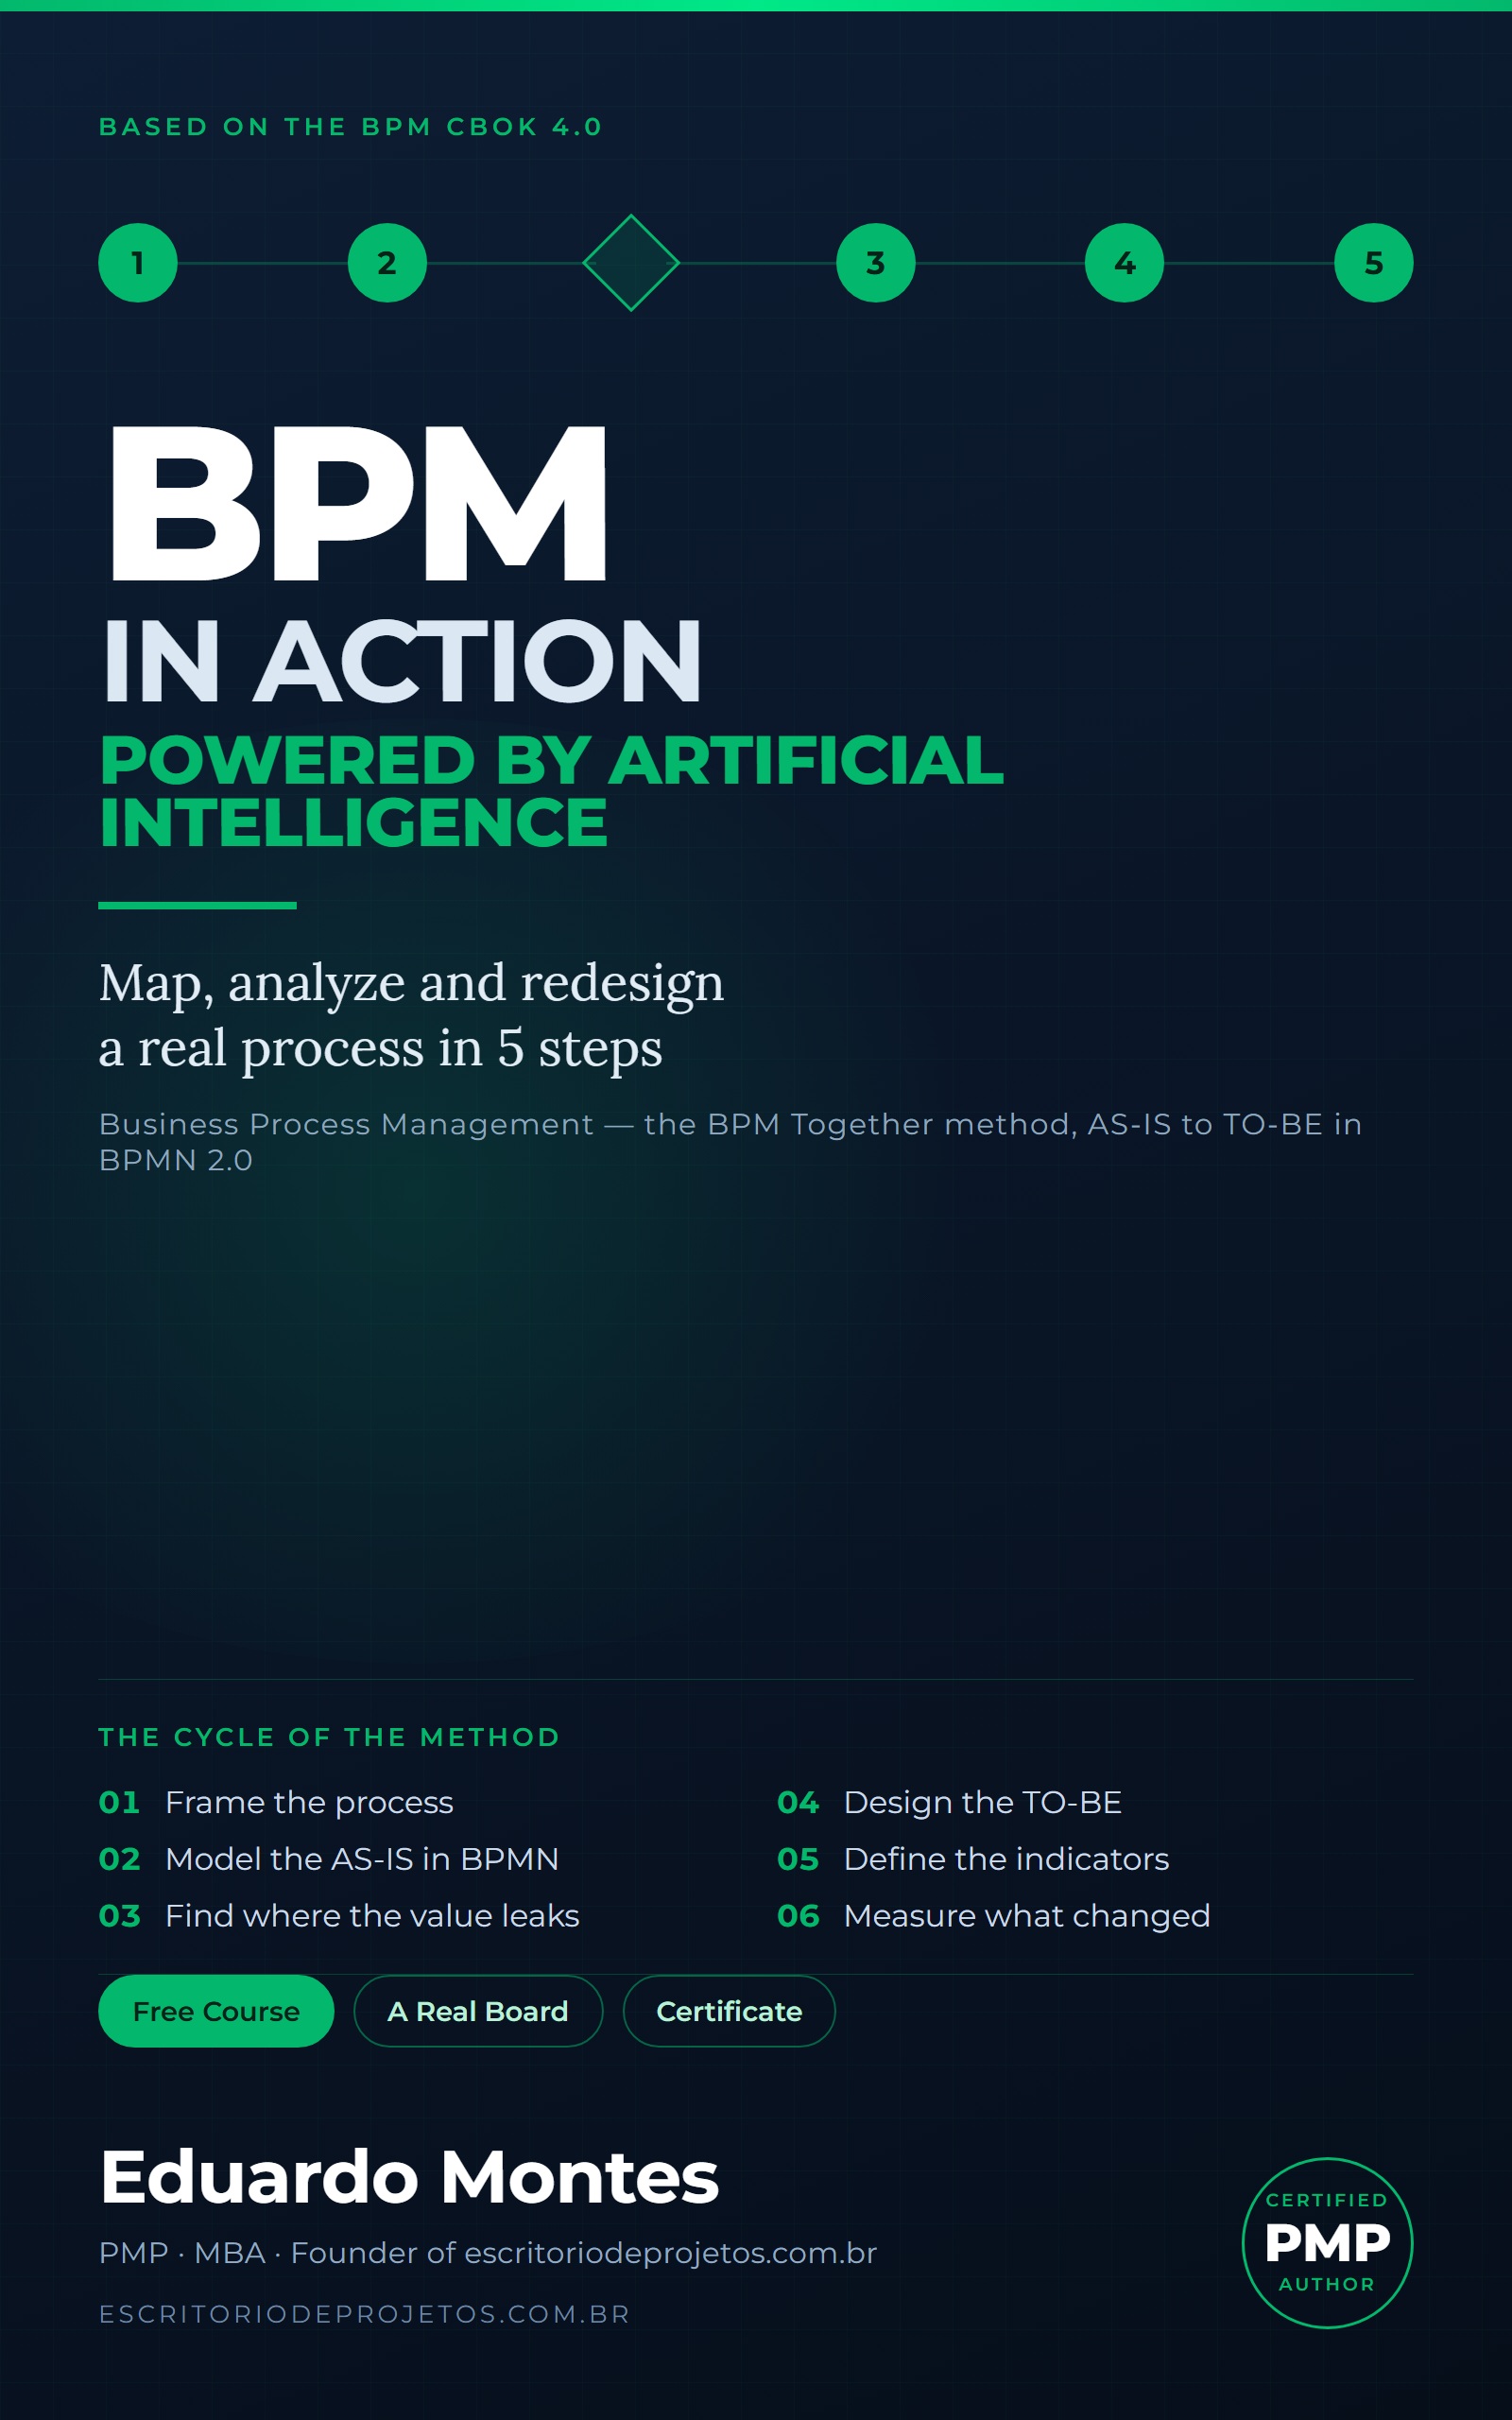
BPM in Action
Map, analyze and redesign one real process of your own in 5 steps — from the AS-IS draft to a BPMN 2.0 diagram, with AI at every phase.
See the book — US$ 5.99 →
 Project Management